
So far we know about
Next : starting to understand the notion of an "object" .
We'll use graphics "objects" - circles, rectangles, and so on - as a vehicle for exploring what an "object" is in computing.
There are two graphics different graphics libraries you can use.
The first choice is Zelle's , which is more mature and which I would recommend, but which will require you to either get python working on your own computer, or to use the Bennington lab computers. It won't run on jupyter.bennington.
Your other choice is my drawing.py which will run in a jupyter notebook.
I'll use Zelle's library for the discussion below, and describe my drawing.py elsewhere.
And I'll show both in some videos.
Object oriented programming is a popular paradigm these days. It's not the only one, but it's an important one.
An "object" is a abstration chunk of data (a "thing") with actions (called "methods") it can perform.
A "class" is a kind of object. Example: Point, Circle, GraphWin
An "instance" is a specific object: Example: that red circle right there.
In python, creating an instance is done this way :
p = Point(10, 20) # instance_variable = ClassName(argument1, arg2)
And once we have one, we can tell it do things like this:
p.move(2, 3) # change position (x,y)=(10,20) to (12,23)
An "API" (Application Programmer's Interface) is a description of which sorts of objects you can create, and what methods they have.
All this is pretty abstract, so let's look at some concrete examples.
See the resources page or check out the web page for Zelle's textbook for both (1) the file you'll need to run this stuff (put in in the same directory), and (2) the API of what you can do with it.
It's possible that your python installation doesn't yet have the right system stuff - namely tkinter - to run Zelle's graphics library. So if this doesn't work for you we'll need to play around a bit.
You'll need the graphics.py module (i.e. file) from Zelle. And it needs to be somewhere where your python can find it, typically in the same folder as the python file you're running.
If you're using IDLE, then you need to get it to the same folder as the graphics.py file. One way to do that is store a .py file of your own in that folder, then open that file.
# You'll need to do this to use Zelle's graphics:
from graphics import *

# If that doesn't work, make sure you have his graphics.py file.
# Then make sure you're running python in the folder with graphics.py.
# You can see what the folder is with :
import os
print "The current directory is ", os.getcwd()

# And you can change the folder with
os.chdir(full_path_to_a_folder)
I will do some demos in the videos of using this library, things like :
... and so on
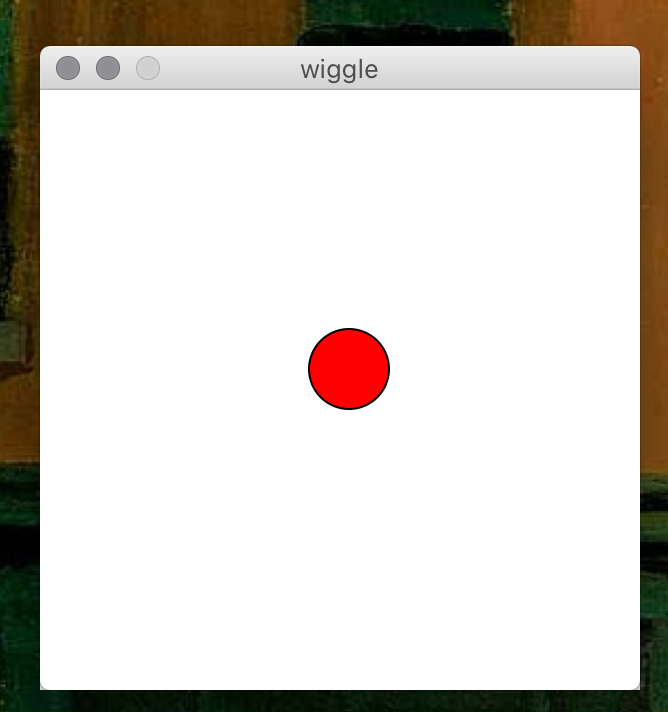
# wiggle.py
#
# a demo of Zelle's graphic library
#
#  new python functions:
#
#     from random import randint
#     randint(low, high)   low <= random num <= high
#
#     from time import sleep
#     sleep(2)             do nothing for 2 sec
#
# Jim M | Sep 2012 | MIT License

from graphics import *
from time import sleep
from random import randint

def main():
    window = GraphWin("wiggle", 300, 300)
    dot = Circle(Point(150,150), 20)
    dot.setFill("red")
    dot.draw(window)
    for i in range(100):
        dx = randint(-5, 5) # pixels
        dy = randint(-5, 5)
        dot.move(dx, dy)
        sleep(0.1)  # in seconds
    wait = window.getMouse()

main()
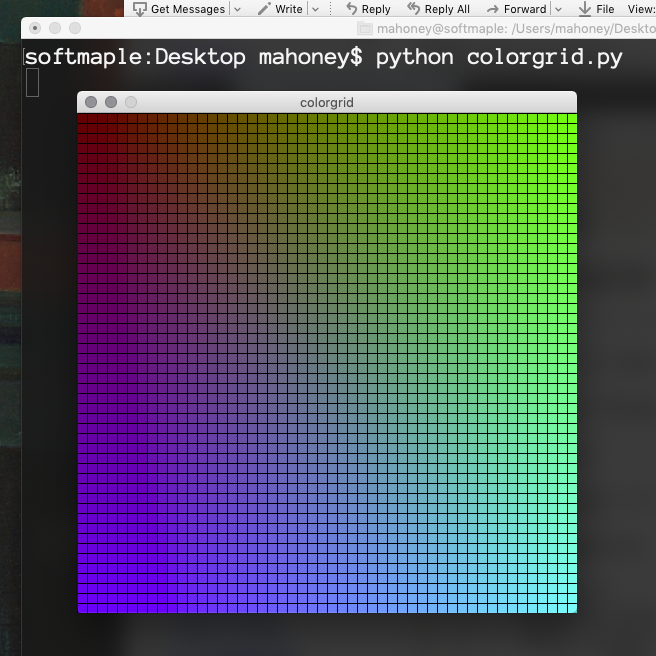
Here's another example. This one doesn't have any animation or random numbers ... just lots of small rectangles, with smoothly varying colors.
# colorgrid.py
from graphics import *

def main():
    window_width = 500       # size of window in pixels
    cell_width = 10          # size of each small rectangle
    red = 100                # RGB colors are (red,green,blue)
    window = GraphWin("colorgrid", window_width, window_width)
    for x in range(0, window_width, cell_width):
        for y in range(0, window_width, cell_width):
            rect = Rectangle(Point(x, y),
                             Point(x + cell_width, y + cell_width))
            green = int(255*(x/window_width))  # from x : 0 to 255
            blue = int(255*(y/window_width))   # from y : 0 to 255
            color = color_rgb(red, green, blue)
            rect.setFill(color)
            rect.draw(window)
    wait = window.getMouse()

main()
The link to the Jim's drawing library is over to the left.
Some of examples in drawings_demos are the sort of thing that you'll be trying in this week's Sol LeWitt Lab.
I have also posted a video about the RGB color model used by computer systems.
Computers use an RGB (red, green, blue) model of color. Each value is a number from 0 to 255 giving the intensity of that color. (0,0,0) is black; (255,255,255) is white.
This model is "additive", like spotlights, so that more gives a lighter, brighter color. Paint on canvas works differently : more paint is a darker color.
Why three primary colors? This has more to do with how our eyes work (three color receptors) than the physics of light itself. The choice of which colors we call "primary" is somewhat arbitrary. For example, in digital printing the colors CMY (cyan, magenta, yellow) are used instead of RGB.
Why 255? Each color takes up one byte of memory, 8 bits, and that's as high as we can count going from 0b00000000 to 0b11111111 in binary.
Using hexadecimal (base 16) notation, each number from 0 to 255 is represented by two characters from 0 to f, where f is 15, so 00 to ff. ("ff" as a number in base 16 is 1516 + 151 = 255).
You can think of each color as being a coordinate in an abstract color cube, which has one corner at (0,0,0) and the opposite corner at (255,255,255). Then the eight corners are
Here are some places to read about this and see the colors.
![[paper clip]](/courses_static/images/paper_clip_2.png)
| last modified | size | ||
| screenshot.png | Mon Sep 07 2020 01:06 pm | 226K | |
| wiggle.png | Mon Sep 07 2020 01:08 pm | 185K |