
... start recording
Questions about anything?
Last week we started talking about objects and graphics, and in particular using Zelle's graphics.py to draw shapes and interact with them.
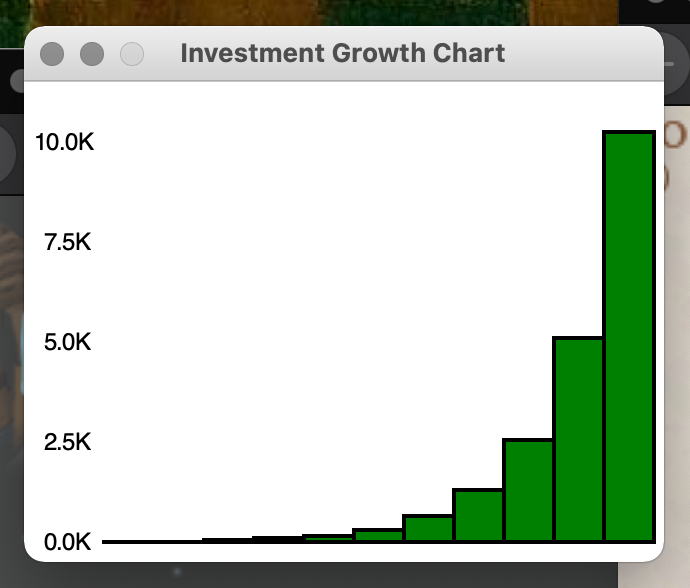
I'll do another demo as a reminder - a bar graph - and illustrate the
use of the window.setCoords method that lets you set up your own
coordinate system.
The demo that I'll do will be something like this futval_graph2.py from chapter 4. Here's the python source code.
There aren't classes on Thursday, so we don't meet again until next Monday.
Write a python program using Zelle's graphics.py that lets
the user click on three points, shows each of those points,
and then draws a triangle with those corners.
Update : I've attached the two files I showed in class (demo.py and triangle.py) below.
This week's assignment - objects and graphics, chapter 4 - is still due at the end this week, including the Sol LeWitt art lab project.
After that, the assignment due by a week from Thursday is the chapter 5 material, on strings and lists. If there's time today after our graphics practice, I'll walk you through some of that to get you going.
![[paper clip]](/courses_static/images/paper_clip_2.png)
| last modified | size | ||
| demo.py | Mon Mar 08 2021 11:24 am | 1.0K | |
| triangle.py | Mon Mar 08 2021 11:24 am | 512B |